In this article, I am going to tell you 10+ Tools for Data Analysis. so if you want to know about it, then keep reading this article. Because I am going to give you complete information about it, so let’s start.
Data analysis refers to the method of working with data to arrange it appropriately, explain it, make it presentable, and arrive at a conclusion from it.
It is carried out in order to extract pertinent data from the data and use it to develop sound judgments.
It’s crucial to comprehend that data analysis is only performed for decision-making. The basic goals of data analysis are the interpretation, assessment, and arrangement of the data as well as the presentation of the data.
If you’re looking for accessible ways to get started with data analysis, there are several free AI tools for data analysis that can help you streamline the process and derive insights from your data efficiently. You may create replication, ETL, ELT, reverse ETL, and ETLT using Integrate.io’s user-friendly graphic interface.
Today’s article focuses on the same,i.e, “10+ Tools for Data Analysis” The articles entail each bit of information necessary for you to know.
Let’s get started!✨
Table of Contents
Data Analysis Methods
Data analysis can be done in two ways:
- Qualitative analysis: Interviews and observations are used to do qualitative analysis.
- Quantitative analysis: Surveys and experiments are used to do quantitative analysis.
Difference Between Data Analysis, Data Mining & Data Modeling
The data analysis goal is to uncover the solutions to particular queries. Business analytics and business intelligence approaches are comparable to data analytics techniques.
Data mining is the process of looking for patterns in data. For this, different computational and mathematical procedures are applied to data to create new data.
Data modeling covers data management and organization. Data is applied here using a variety of strategies and techniques. Data modeling requires data analysis.
In this article, we’ll look in-depth at the top data analysis programs and their features.
10+ Tools for Data Analysis
Below I am going to tell you about 10+ Tools for Data Analysis, which are as follows.
1. IPWhois.io
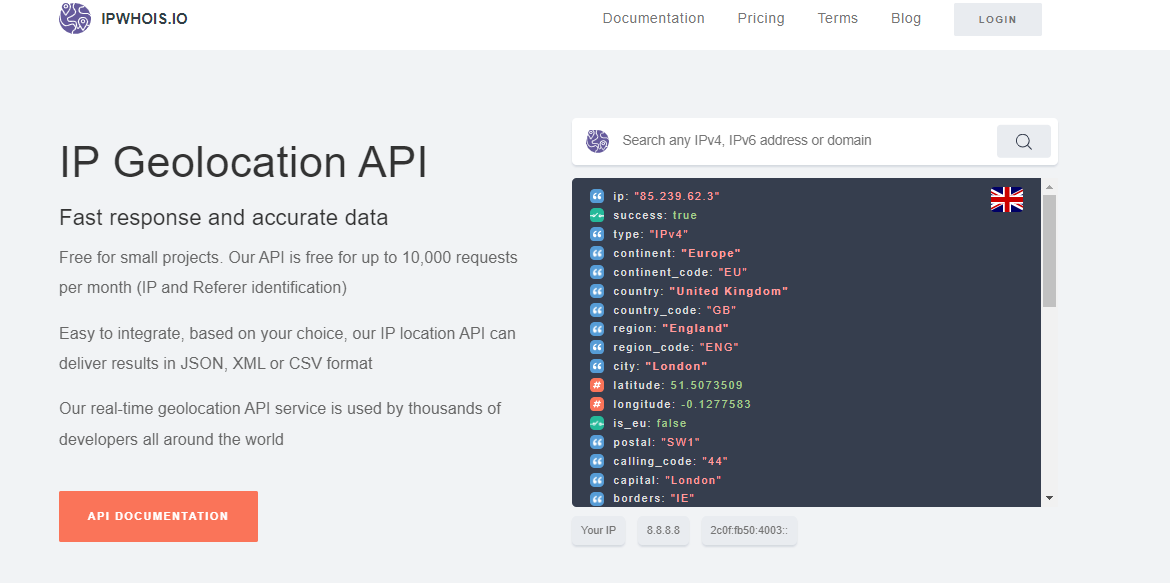
IPWhois.io is a fast and reliable service that provides valuable insights based on geolocation using users’ IP addresses and competitors’ data. Using the IP geolocation API, you can create more relevant and personalized content options for your local business.
The best thing about IPWhois.io is the ability to detect IP addresses by effectively sending GET requests and processing the responses. It can analyze regional competitors’ consumer profiles and foot traffic at specific locations. The service shows a clear and detailed display of full country names and ensures real-time IP data updates through its highly efficient multi-channel integration structure. Moreover, IPWhois doesn’t require special skills for installation.
Features
- Track all IP addresses for security purposes and geo locations of IP addresses.
- Easy to integrate with different domains
- User-friendly UI for anyone to easily access
- Powerful filters for data selection and extraction
- Include a multitude of languages for API responses
- Detec frauds and attacks on website
- Handle multiple time zones and display prices in local currency
- Minimal security risks and data encryption make intercepting the location data harder.
2. HubSpot
HubSpot provides a marketing analytics tool that may evaluate the effectiveness of advertising efforts. It is an all-in-one inbound marketing tool with features for blogging, landing pages, marketing automation, lead management, analytics, and so on for your entire group or crew members.
Features
- With HubSpot Marketing Analytics Software, you can monitor the entire client lifecycle, from the anonymous visitor to the devoted customer.
- It offers the ability to segment any report based on the properties of contacts or companies in your database.
- You can create events using the feature to keep track of website activity. You can use this functionality to understand customer behavior and start automation workflows.
- With the aid of important website metrics, you may evaluate the effectiveness of the website.
- All of the HubSpot CRM’s functionality, in addition to features like forms and email marketing, are accessible in free marketing tools.
3. Hevo Data
Hevo is a Fully Automated, No-code Data Pipeline Platform that helps organizations leverage data effortlessly. Hevo’s End-to-End Data Pipeline platform enables you to easily pull data from all your sources to the warehouse, and run transformations for analytics to generate real-time data-driven business insights.
The platform supports 150+ ready-to-use integrations across Databases, SaaS Applications, Cloud Storage, SDKs, and Streaming Services. Over 1000+ data-driven companies spread across 40+ countries trust Hevo for their data integration needs. Try Hevo today and get your fully managed data pipelines up and running in just a few minutes.
Features
- With Hevo Data, you can format your data in real-time using either a drag-and-drop interface or a python interface and generate data ready for analysis through SQL-based post-load transformations.
- Hevo automatically maps source and destination schemas to avoid errors.
- The platform provides real-time visibility into the ELT process through its dashboards, alerts, and activity logs.
- Hevo offers customization options, such as flexible data ingestion modes, and allows you to connect to over 150 integrations with precise control over pipeline schedules.
- The platform also offers 24/7 live chat support and end-to-end encryption, ensuring compliance with major security certifications like HIPAA, GDPR, and SOC-2.
4. Zoho Analytics
Zoho Analytics helps you perform effective and economical data analysis. You may use Zoho Analytics to get your data examined no matter where it is.
Zoho Analytics stands out with its extensive selection of data visualization tools. Utilize its AI-powered assistant, which enables users to ask inquiries and receive insightful responses in the form of pertinent reports.
Features
- There are many different visualization options, including charts, pivot tables, summary views, KPI widgets, and dashboards with custom themes.
- An intelligent assistant powered by AI and ML that can comprehend questions posed in natural language is used to augment analytics.
- Elegant mobile apps that provide interactive data analysis of dynamic data for iOS and Android.
- analytics in combination with granular access control.
- Using clever modeling, join linked data tables.
- data blending for cross-functional analytics from many data sources.
- There are more than 100 connectivity options with pre-built reports and dashboards, a drag-and-drop report and dashboard creator, natural language querying, and a smart AI assistant.
5. Dataddo
Dataddo is an essential component of the data architecture that gives analysts access to the cleansed and integrated data they need to complete their tasks successfully. It is not a tool in and of itself for performing data analysis.
With a large selection of connections and fully customizable metrics, Dataddo is a no-coding, cloud-based ETL tool that makes the process of building data pipelines simple.
You don’t need to add components that you weren’t already utilizing because the platform effortlessly integrates into your current data stack. You can concentrate on integrating your data rather than spending time in learning how to operate your ETL solution thanks to Dataddo’s user-friendly interface and straightforward installation.
Features
- Having a user interface that is simple and friendly to non-technical users
- may quickly deploy data pipelines after creating an account.
- adaptable integrates with consumers’ current data stack.
- No-maintenance: Dataddo team manages API modifications.
- Upon request, new connectors can be introduced within 10 days.
- GDPR, SOC2, and ISO 27001 compliance for security.
- Characteristics and metrics that can be customized while constructing sources.
- Centralized management system to simultaneously check the progress of all data pipelines.
6. Query.me
With the exception of SQL, Query.me’s straightforward tools let you study and visualize your data. You may go deeper into data to gain business insights using potent SQL notebooks.
Query.me attempts to set itself apart from the competition by providing a SQL-first solution that makes your workflow more effective, current, powerful, and generally more effective. SQL is becoming more and more relevant every day.
Features
- Effective Notebooks to replace your outdated, unkempt scripts.
- Fully functional Jinja templating for more modular and reusable programming.
- Electronic reporting
- full support for self-service.
- More customization and analysis possibilities are made possible by a constantly expanding variety of block kinds.
7. Tableau Public
Tableau Public’s assistance can help you develop applications, widgets, charts, graphs, and maps. You can share and publicize all of your works with it. It works with both Windows and Mac OS.
It offers server and desktop solutions as well as an online option. You can connect to any data, from anywhere, with Tableau Online. Tableau Desktop, Tableau Server, Tableau Online, Tableau Prep, Tableau Public, and Tableau Reader are the six products offered by Tableau Public.
Features
- It offers automatic layouts for phones and tablets.
- It gives you the option to alter these layouts.
- Transparent parameters, filters, and highlighters are all programmable.
- The dashboard zones’ preview is visible.
- You can combine datasets based on a place.
- You may connect to cloud databases like Amazon Redshift, Google BigQuery, and Tableau Online.
- Tableau Prep has features like instant results that let you choose and update the values right away.
8. RapidMiner
RapidMiner is a software solution for text mining, machine learning, deep learning, and the deployment of prediction models. It offers all data preparation features.
Through automated machine learning, the tool will assist data scientists and analysts in increasing their productivity. With the use of RapidMiner Radoop, data analysis may be completed without the need for programming.
Features
- Internal security measures.
- Radoop takes the place of having to write the code.
- It has a Hadoop and Sparks visual workflow designer.
- You can use big datasets for Hadoop training thanks to Radoop.
- centralized control over the workflow
- It supports Hadoop impersonation, sentry/ranger, and Kerberos.
- It groups the queries and utilizes Spark containers again for clever process efficiency.
- Group cooperation
9. KNIME
KNIME offers an open-source tool for data analysis. You may develop data science services and apps using this platform.
You may create machine learning models with it. You can do this by utilizing cutting-edge algorithms like logistic regression, deep learning, and tree-based techniques. The KNIME Analytics platform, KNIME Server, KNIME Extensions, and KNIME Integrations are among the software products offered by KNIME.
Features
- It offers a GUI where you can design visual workflows by dragging and dropping elements.
- No coding knowledge is required.
- It enables you to combine tools from several fields, such as machine learning, Apache Spark connectors, R and Python scripting, and scripting.
- advice on creating workflows.
- processing data in multiple threads.
- processing is done in memory.
- sophisticated charts(bar chart, line chart, radar chart etc.) for data visualization.
- You can alter the charts in accordance with your needs.
- KNIME Server facilitates team-based collaboration and automates workflow execution.
- You can integrate with Big Data, AI, machine learning, and scripting with KNIME Integrations.
- You may import, export, and retrieve data from big data channels like Hive, Impala, etc. with the aid of KNIME Integrations.
- KNIME Extensions enable you to expand the functionality of your platform.
10. Orange
Orange is a toolbox for machine learning and data visualization.
It is an open-source system that both novices and experts can utilize. It works with the Windows, Mac, and Linux operating systems. It enables you to perform data analysis using visual programming. Numerous categorization and regression algorithms are offered.
Features
- Interactive data visualization is offered.
- The workflow history of each widget and graphic is included in clever reporting.
- Excellent scatter plot and clever visualization.
- Exploratory data analysis is possible.
- There are many common visualizations present.
- You can choose data points from a scatter plot, a node in a tree, or a branch in a dendrogram using this interactive visualization tool.
- Orange remembers the decisions you’ve made for data analysis and makes recommendations based on them.
11. OpenRefine
OpenRefine is a free and open-source program for data analysis. OpenRefine will assist you in cleaning, transforming, and extending your data, even if it is disorganized. You can change the data format with the aid of this tool. You can use web services and outside data to expand the data as well. It is offered in fourteen different languages.
Features
- Working with huge data sets won’t be difficult for you.
- Using online services, it enables you to link and expand the data.
- Through OpenRefine, you can upload the information to a central database for some services.
- The data can be cleaned and changed.
- You may import Google Spreadsheets, Google Fusion Tables, CSV, TSV, XML, RDF, and JSON.
- The data can be exported in Microsoft Excel, TSV, CSV, HTML tables, and these formats.
12. Looker
Looker will support you in data management, analytics, visualization, and business intelligence. It is a platform built on the cloud.
Looker offers drag-and-drop functionality for items, role assignment, and mapping features for user-friendliness. It offers precise graphs and tables so you can readily view the data in further detail. It aids in the development of small applications. Look ML is a language that can be used for this. Learning this language is simple.
Features
- It offers data security that is strong.
- It searches the data for the answer, finds it, and caches it for data security. After 30 days, the cache will be automatically erased; however, you can reduce this period.
- Setting access restrictions and managing permissions both contribute to data security.
- Fresh data will be taken straight from the source for visualizations.
- Row-level details are available for more information.
- It offers a huge library of visualizations.
- With Looker, JavaScript will enable you to create any visualization. Your Looker instance will allow you to store it.
- You may personalize the reports for Facebook Ads and Google Ads.
13. Talend
Talend is a platform for integrating data that is hosted in the cloud. There is also an on-premises option. AWS, Google Cloud, Azure, and Snowflake are all compatible. Public, private, and hybrid cloud infrastructures are all supported.
It offers both paid and unpaid products. Both Windows and Mac can be used with free items. For data management, data quality, and data integration, Talend provides a variety of features.
Features
- You can create cloud apps, relational databases, and flat files 10 times faster with the aid of the data integration solution.
- IoT analytics in real-time.
- Not necessary to manually code. You can develop, test, and deploy with the aid of cloud API services.
- You may map, aggregate, sort, enhance, and integrate the data using Talend Open Studio for data integration.
- For file administration, scripting is not necessary.
- Numerous databases, SaaS, packaged apps, and technologies can be linked with Talend.
- There are numerous designs and development tools in the open studio.
14. R-Programming
R is a programming language that gives away a free software environment. It is used for graphics and statistical computations. It works with UNIX, Windows, and Mac.
You can use it to link C, C++, and FORTRAN programs. It offers aspects of object-oriented programming. R is an interpreted language since many of its versions directly sequence analysis.
Features
- It offers methods for both linear and nonlinear modeling.
- Classification\sClustering
- Through functions and extensions, it can be expanded.
- It has the ability to analyze time series.
- R is the language used to write the majority of standard functions.
15. Google Fusion Tables
It is a web application that will assist you in compiling, displaying, and disseminating the data from data tables. Large data collections are compatible with it. The data from thousands of rows can be filtered. Through charts, maps, and network graphs, you can see the data.
Features
- Information is automatically saved to Google Drive.
- Public fusion tables are searchable and observable.
- You can submit data tables from spreadsheets, CSV files, and KML files.
- You can programmatically insert, update, and delete the data using the Fusion Tables API.
- The CSV and KML file formats are available for data export.
- It enables you to share your data, and shared data always displays real-time data values.
- Two tables may be combined. You can combine data belonging to other persons thanks to this capability.
- If one table’s data is updated after merging, you will still see this new data in the merged table. Maps can be created from location tables.
Conclusion:)
By this point, we hope you have a better understanding of how cutting-edge technologies can assist analysts in carrying out their tasks more successfully in a setting that is less prone to error. In conclusion, almost all these tools offer a 14-day trial that is absolutely free and has no additional fees if you wish to start an exhilarating analytical trip and test data analytics software for yourself.
Read also:)
- How Data Analytics is Transforming Business: A-to-Z Guide!
- How to Become a Data Scientist in India: The Beginner’s Guide!
- How to Earn Money by Data Entry: A-to-Z Guide for Beginners!
So hope you liked this article on 10+ Tools for Data Analysis. And if you still have any questions or suggestions related to this, then you can tell us in the comment box below. And thank you so much for reading this article.