In this article, I am going to tell you What is Heatmap Tool And why it is used. so if you want to know about it, then keep reading this article. Because I am going to give you complete information about it, so let’s start.
As you all know, Every online business owner wants to create a website that is as user-friendly and optimized as possible.
It shows that the website’s elements are arranged so that people may find what they’re seeking fast. Naturally, you may do this by utilizing certain technologies that notify us about user activity.
Using free survey tools or a heatmap tool, you may ask your visitors. A marketer’s toolkit should include heatmaps. They provide the necessary information for setting up the website in a user-friendly way.
Google Analytics provides the majority of website analytics, including bounce rates for specific websites. In addition, a tool called session replay displays the precise mouse movements of each visitor to a website.
But what is a heatmap and what data does it provide?
Table of Contents
What is Heatmap Tool?
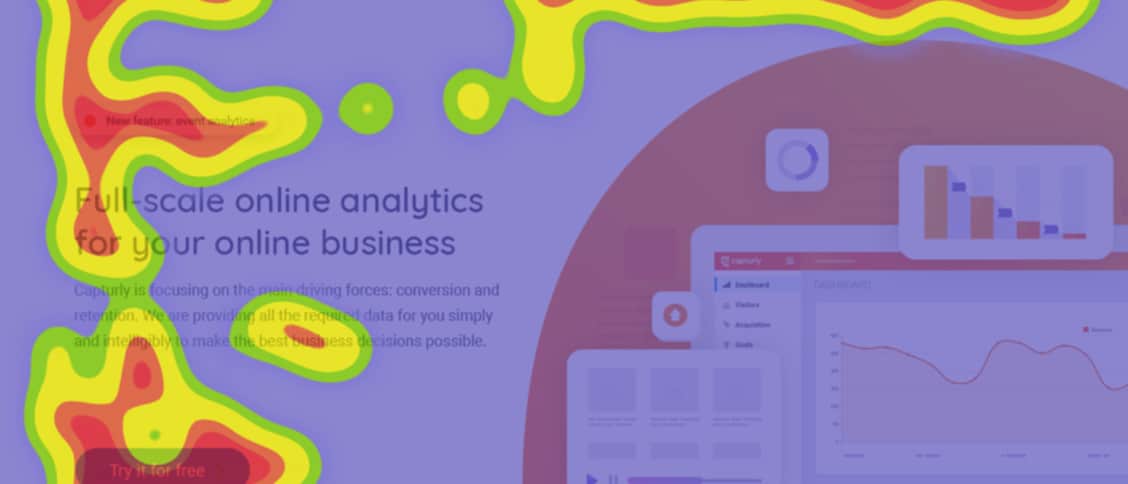
Designers of user experiences are already familiar with the phrase heatmap. It is a method of displaying data that keeps track of user mouse movements and highlights potential hot spots.
Heatmaps provide the scrolling distance in addition to tracking clicks that occur everywhere on the website.
The representation of a heatmap on a website is quite similar to other heatmaps; for instance, heatmaps are frequently used in sports, particularly football, where the movement of specific players is recorded and then visually depicted.
Color serves as the most fundamental dividing line between the areas of the website that are more and least inhabited. Typically, the red hue denotes the most inhabited areas, whereas the blue color denotes the less populated, “colder” areas.
Heatmaps aggregate user behavior, which makes it easier to combine quantitative and qualitative data for data analysis.
In order to identify trends and improve your website and product to increase user engagement and sales, they provide you with a rapid knowledge of how your target market interacts with certain products or website pages, including what they click on, scroll through, or ignore.
What are the benefits of heatmaps?
Why are my users not converting? What can I do to get more visitors to act?
These are just two of the important business concerns and goals that heatmaps assist product managers and website owners in addressing. Heatmaps allow you to ascertain whether users are:
- Reaching crucial information or missing it
- Locating and using the primary links, buttons, opt-ins, and CTAs on a page
- Being sidetracked by inactive elements
- Having problems with several devices
Heatmaps are a visual tool that may assist you in making data-driven decisions for A/B testing, website updates, and design.
UX and UI designers use heatmaps to gauge the popularity or unpopularity of a page design and implement modifications that will make it simpler for consumers to navigate their website. Product teams may test how users engage with a new product or rank issue fixes using heatmaps.
Additionally, you may make a collection of heatmaps to emphasize particular aspects that your company or team should target.
To reduce churn and boost sign-ups for a website or product, a digital marketer might, for instance, develop a heatmap collection to test a landing page and then opt to position a CTA button above the average fold.
Types of heatmap tools?
There are different types of heatmaps, and every type gives different useful information about your users and website.
- Segment heatmap
- Click heatmap
- Scroll heatmap
- Mouse tracking heatmap
1. Segment heatmap
The term market segmentation is well-known among business owners who are interested in marketing.
This refers to the dispersion of the target market into more precise, smaller sections in marketing. You have the possibility to filter the traffic coming from different sources thanks to segmentation.
Using segment heatmaps, you can contrast the behavior of new and recurring visitors, visits coming from certain operating systems and browsers, visits coming from specific devices, and visitors coming from organic versus direct sources.
With this knowledge in your possession, you may identify connections by disentangling various sources.
2. Click heatmap
Click maps display the precise locations of user clicks on a website. They are the heatmaps with the highest level of specificity.
Unlike other heatmaps, they display the precise location of where the majority of clicks are focused.
Because the user’s attention is often where the mouse pointer is when the click occurs, clicking is a potent symbol of interest. For instance, they may point up areas where visitors may repeatedly be clicking on inactive links or other elements.
Additionally, click heatmaps demonstrate if visitors really click on the parts you intended to be significant, if not, changes need to be made.
3. Scroll heatmap
These maps horizontally display how the page is used or how far users have scrolled. Horizontal bands of color are utilized to depict the scroll heatmaps’ usage.
The warmer the color, the more frequently this section of the website is used. The hues of the horizontal bars become cooler as we scroll further down the page.
And when the pages are particularly long, it is much more obvious because some people might never get to the bottom of the page.
Even with the busiest and most optimized websites on the internet, it is common to observe such patterns. The proper placement of the parts and the site’s content actually make the difference between a good website and a badly optimized webpage.
According to an expert’s analysis of a scroll heatmap, the most important and pertinent material of the website will be located there.
Although less precise than motion maps or click heatmaps, this style is nonetheless quite helpful.
Using scroll heatmaps, you may get immediate feedback on the whole website depending on how users scroll. Simply lower the red and yellow bars as far as you can to achieve your objective.
Naturally, the region above the fold will receive most of the focus for the red zone, but with some inventive design strategies, you may maintain a sizable portion of the attention when visitors scroll down to the footer area.
4. Mouse tracking heatmap
Session replay is another name for the mouse tracking heatmap.
A heatmap of this type is a tool for data visualization that demonstrates how users interact with your website. Think of it as the same as starting a screen recorder on a visitor’s computer or mobile device while they are on your website.
It shows what visitors to your website are viewing or clicking. As you can see, this information is quite important, especially if you want to improve or raise the conversion rate of your website.
To determine which CTA buttons and messages are the most successful, use session replay.
It also offers details on how visitors to your website use it. Although this is comparable to heatmaps, please believe us when we explain that it is completely different.
As long as the heatmaps display locations on your webpage, mouse tracking analysis heatmaps analyze each visitor separately. This gives a far more comprehensive investigation, in our opinion.
You may use this tool to keep tabs on which of your site’s subpages users are visiting and their origins. This will enable you to spot a pattern in how visitors utilize your website.
With this information, you may modify your website to better satisfy the needs of your users.
Top mistakes during website optimization
You must be wondering at this point what errors we are referring to. Contrary to popular belief, there are many faults that may be committed when optimizing the user experience.
We will only discuss measurement-related errors here. Check out what these may be:
- You just utilize heatmaps for analytical purposes.
- Do not forget big data
- Do not use the force of social media
If you want to improve the user experience of your website, heatmaps are an amazing tool and source of data. Never, however, utilize a single tool. This is crucial since it is simple to make mistakes using one technique.
To obtain the most accurate information, always employ A/B testing or, if possible, session replays with heatmaps. The likelihood of a mistake is reduced as a result. It can help you save both time and money.
Don’t forget about big data either. You can analyze patterns based on a lot of data. Take, for instance, the growth of the traffic to each of your subpages. And you can easily link that data to UX.
Make sure not to commit these errors.
Free social media tool
Everybody thinks that a free tool is not as effective as a paid one. This is not true.
There are several tools for free that can provide useful data and features for free, such as Social Champ.
Social Champ is an all-in-one social media management tool with automation support for prominent social media platforms. This tool allows you to create, edit, publish, schedule, and analyze your social media content from one place.
Social Champ’s powerful features include a social media calendar, bulk uploader, integrations within the dashboard, analytics monitoring, sentiment analysis, auto-RSS, team collaboration, and multiple workspaces.
Once you have posted the content or pushed it to the queue for scheduling, you can keep an eye on an organized social media calendar and your activities.
Moreover, the software also allows you to monitor your published posts’ analytics so you can know what content type works best for your social accounts.
The tool offers a forever-free plan with 3 social accounts and 1 user onboard; the other paid plans are also available as per business size.
Conclusion:)
You can see that improving the user experience and the whole website also depends greatly on data visualization. When performing UX and website optimization, using heatmaps is highly advised.
To detect long-term relationships, repeat the analyses at regular intervals. The long-term user-friendliness of your website depends on this information.
Use this blog as a quick reference.
We hope we can help.
Read also:)
- What is Website Localization? And why is it important: A-to-Z Guide!
- How to Make Website Attractive and Professional: A-to-Z Guide!
- 20+ Best Software for Web Development: A-to-Z Guide for Beginners!
So hope you liked this article on What is Heatmap Tool And why it is used. And if you still have any questions and suggestions related to this, then you can tell us in the comment box below. And thank you so much for reading this article.